At dnota, we drive smart cities and sustainable industrial environments 🌆🏭 through Air Quality Consulting for Smart Cities 📊🔍. We optimise sensor networks 📡, ensure regulatory compliance 📜✅ and design strategies to improve air quality 🌱.
In addition, we offer training in environmental monitoring and Smart Cities 🏙️📚, helping administrations and companies in the transition to Low Emission Zones 🚗💨 and more sustainable industrial models 🌎⚡.
💡 Air quality defines the future. Contact us and transform your city with innovation! 🚀♻️
Translated with DeepL.com (free version)
Service Models with Bettair Sensors
In addition to the purchase and sale of Bettair sensors, we offer different service models that enable cities to improve air quality in a flexible and to improve air quality in a flexible way, tailored to their needs.
Measurement Campaigns with Bettair IoT Sensors
- We conduct temporary studies to assess air quality in specific areas.
- Instalamos sensores IoT Bettair durante un periodo determinado y analizamos los datos recopilados.
- We deliver detailed reports with diagnostics and recommendations for action.
Bettair Sensor Rental
- Cities can rent Bettair sensors for a fixed period of time, without the need for an initial investment in equipment.
- Rental includes installation, configuration and maintenance of the sensors.
- Real-time access to the Bettair platform to visualize and analyze data.
Sale of Bettair Sensor Data
- We offer air quality data captured by our Bettair sensor network network of Bettair sensors deployed in different cities.
- It allows administrations, companies and research centers to access historical information in real time.
- Validated and ready-to-use data for modeling and decision making.
These modalities complement our technological offering, allowing cities to adapt air quality monitoring to their needs and budget without compromising the accuracy or reliability of the data obtained.
Helping you understand air qualitydata and make decisionsatos de la calidad del aire y tomar decisiones
Our goal is not only to measure but to interpret the data to provide solutions that improve the quality of life in your city. The Bettair platform not only presents real-time data but also analyzes it to identify patterns and underlying causes of pollution. The collected data helps identify critical points in urban planning, mobility, and public health, aiding in the development of effective strategies to address environmental issues. Thanks to this information, businesses and administrations can make evidence-based decisions, optimizing sensor placement, implementing low-emission zones, and complying with current environmental regulations. At dnota, we offer specialized consulting in air quality measurement, providing innovative tools to enhance environmental monitoring and reduce pollution with solutions tailored to each environment.
Practical applications and solutions
Turning data into action to improve air quality and urban life

The Bettair Platform and Integration with Reference Stations
The Bettair platform provides real-time data on air quality in cities, and effectively manage pollution levels thanks to its intuitive interface and analytical thanks to its intuitive interface and analytical capabilities.
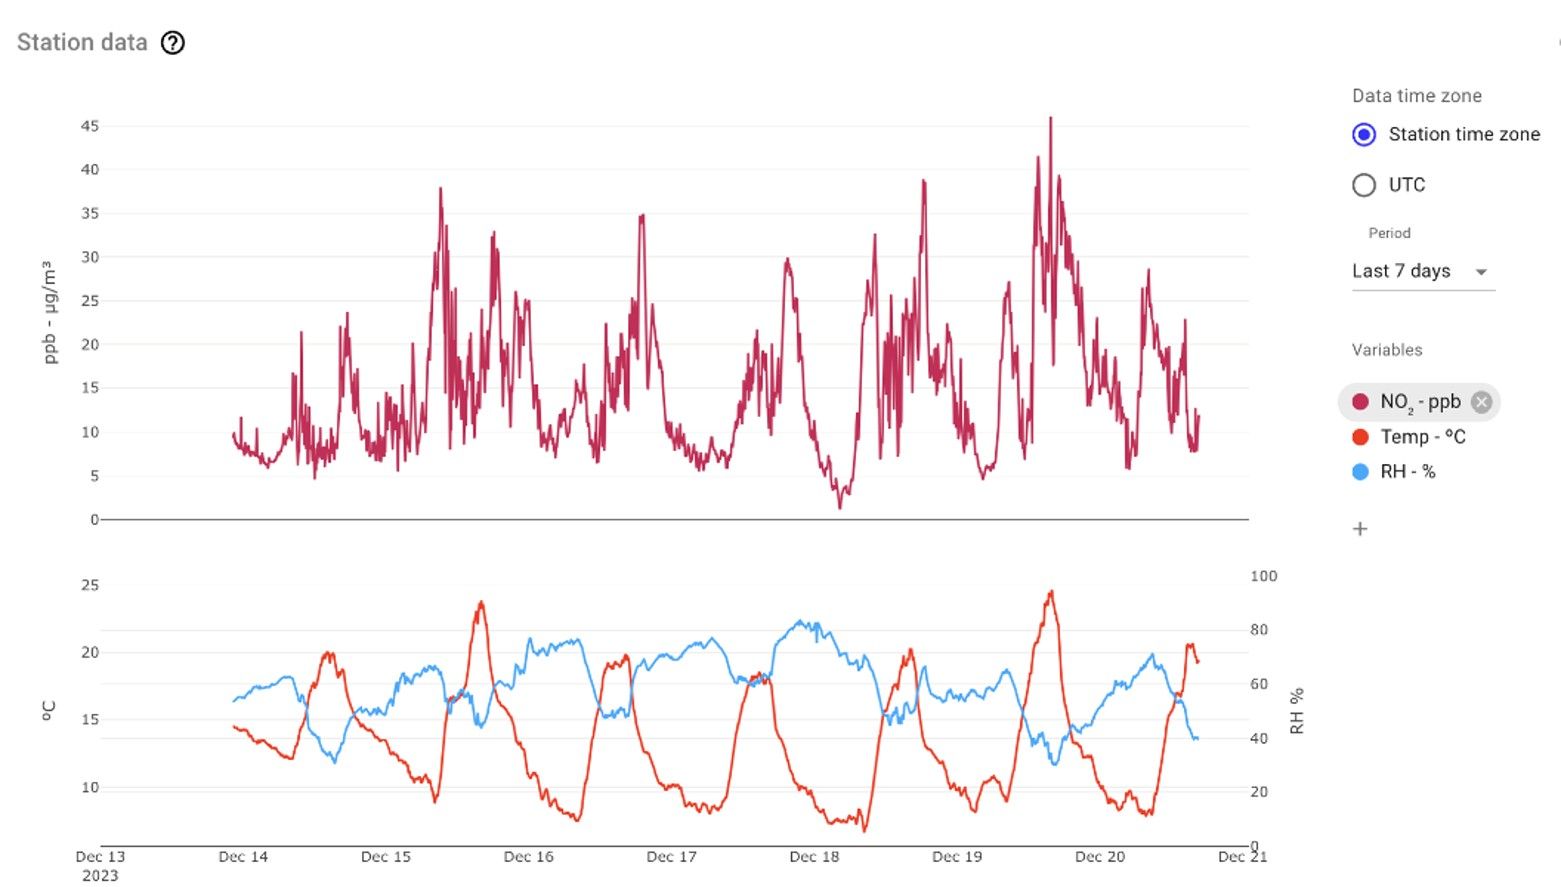
It includes accurate measurements of pollutants such as NOxO3 and PM2.5, along with environmental parameters such as noise, temperature and humidity. Its interactive maps and graphs allow you to identify pollution patterns and critical peaks instantly.

New Functionality Reference StationIntegration

A significant advance is the integration of certified reference stations directly into the same platform.. This allows cities to combine the data from the sensors with the IoT con los datos validados de estas estaciones oficiales, ofreciendo una visión mucho más completa y precisa de la calidad del aire.
Key Benefits of Integration
DirectComparison: Cities can compare the pollution levels detected by Bettair sensors with nearby reference stations, This strengthens confidence in the data and helps to validate the reliability of the measurements.
Discrepancy Detection: This functionality allows the identification of possible discrepancies between sensor networks and reference stations, helping to fine-tune monitoring and calibration strategies.
StrategicPlanning: By having validated, real-time data, local authorities can implement more effective policies, such as traffic optimization, industry regulation or design of low-emission zones.
Analysis of the impact of pollution in the city
The platform includes advanced tools such as the Pollution Rose , which allows to analyze the source of pollution using information on wind direction and speed. This tool is key to determine whether the pollution comes from sources outside the city or whether it is internally generated. sources external to the city or if it is generated internally.
If NOx levels are elevated in a specific area, the Pollution Rose can identify whether the emissions are a result of local traffic or from a nearby local traffic or if they are coming from a nearby industrial area, allowing the authorities to take specific measures.
Cities are not isolated entities; external infrastructures such as airports, ports, industrial sites or power plants can generate pollution that directly directly affecting air quality in urban environments.
Mitigating external impact is key to cleaner city air
Implement mitigation measures in infrastructure, such as emissions regulation, use of clean energy and more efficient technologies.
Design green barriers between infrastructure and urban areas to reduce the impact of emissions.
Collaborate with the managers of these infrastructures to develop joint air quality improvement plans.
Tailored Solutions for Sustainable Cities
Analysis and optimization of air quality networks
Determination of optimal sensor locations by analysis of geographic, meteorological and traffic data, meteorological and traffic data. Optimization of existing networks to maximize coverage and efficiency.


DataManagement and Tracking
Supervisión diaria de datos para garantizar la calidad y fiabilidad de las mediciones. Informes periódicos con comparaciones frente a normativas vigentes. Generación de informes finales de campañas, incluyendo la visualización avanzada, como rosas de los vientos y mapas de contaminación.
Training and Awareness Raising
Specific workshops and lectures on air quality, sensor networks and strategies for Smart Cities. Programs adapted to public administrations, companies and technical communities.


SpecializedStudies and Audits
Dispersion modeling and simulation of contaminants. Evaluation of environmental impact for urban and industrial projects. Audits to ensure compliance with environmental regulations .
Mobility and Low Emission Zones Advisory Services
Evaluation of the impact of trafficpatterns on pollution. Design of strategies to implement low emission zones.

Analysis and optimization of air quality networks
Determination of optimal sensor locations by analysis of geographic, meteorological and traffic data, meteorological and traffic data. Optimization of existing networks to maximize coverage and efficiency.
DataManagement and Tracking
Supervisión diaria de datos para garantizar la calidad y fiabilidad de las mediciones. Informes periódicos con comparaciones frente a normativas vigentes. Generación de informes finales de campañas, incluyendo la visualización avanzada, como rosas de los vientos y mapas de contaminación.
Training and Awareness Raising
Specific workshops and lectures on air quality, sensor networks and strategies for Smart Cities. Programs adapted to public administrations, companies and technical communities.
Specialized Studies and Audits
Dispersion modeling and simulation of contaminants. Evaluation of environmental impact for urban and industrial projects. Audits to ensure compliance with environmental regulations .
Mobility Consulting and
Low Emission Zones
Evaluation of the impact of trafficpatterns on pollution. Design of strategies to implement low emission zones.
We promote cleaner and more sustainable cities with tailor-made solutions.

Client Support for Environmental Permitting
Preparation of draft application and update reports on substantial and non-substantial changes.
Support for registration in platforms such as REGADE-COVs Galicia and other environmental databases.
Detailed assessment of project effects on the environment and mitigation recommendations.
Registration of small and large generators of hazardous waste, ensuring regulatory compliance.
Registration and regulation of facilities with emissions to the atmosphere.
Ongoing consulting to ensure compliance with evolving regulations.
Soil condition assessment and documentation for industrial projects or land use changes.
Preparación y acompañamiento en auditorías ambientales realizadas por ENAC y otras entidades regulatorias.
Advice and processing for the controlled discharge of wastewater according to legislation
Improve air quality in your environmentno hoy mismo
Contáctanos para obtener asesoría experta.
